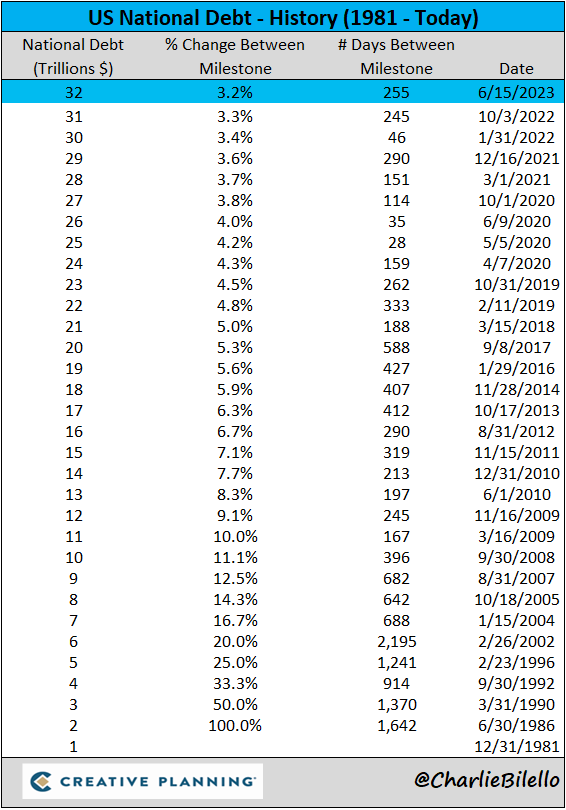
The Week in Charts: Hello $32 Trillion US National Debt
The US National Debt has crossed above $32 trillion for the first time, a 45% increase in the past 4 years. Widening deficits, housing shortage, and the potential for a Q3 recession are discussed in this blog.

Charlie Bilello
Chief Market Strategist @ Creative Planning Investor | Writer | Reader | Thinker Trying to become a little wiser every day.

-
New: The Week in Charts ‼
— Charlie Bilello (@charliebilello) June 24, 2023
-- Hello $32 Trillion
-- Housing Shortage Deepens
-- If You Build It, They Will Come
-- A Q3 Recession?
-- The Downtown Downturn
-- Every Bear Market is Different
-- And more...
📺: https://t.co/TmbD2j5zhN -
(1a) Hello $32 Trillion
— Charlie Bilello (@charliebilello) June 26, 2023
US National Debt has crossed above $32 trillion for the first time, $10 trillion higher than where it stood 4 years ago (45% increase).
Video: https://t.co/S7Q8Y7Y2HY pic.twitter.com/sXHyJ5bDZh -
(1b) Widening Deficits
— Charlie Bilello (@charliebilello) June 26, 2023
The US government continues to spend much money than they’re taking in. The budget deficit has widened to $2.1 trillion, its highest level since February 2021.
Video: https://t.co/S7Q8Y7Y2HY pic.twitter.com/hGjW9YmRkR -
(1c) Rising Debt + Rising Rates = Rising Interest Expense
— Charlie Bilello (@charliebilello) June 26, 2023
Interest Payments by the US Government rose to 3.5% of GDP in Q1 2023, up from 2.4% in Q1 2022. That’s the largest annual increase on record.
Video: https://t.co/S7Q8Y7Y2HY pic.twitter.com/9v2ZIi6WiN -
(2a) Housing Shortage Deepens
— Charlie Bilello (@charliebilello) June 27, 2023
The # of homes in the US for sale fell to 1.37 million in May, the lowest level on record with Redfin data going back to 2012.
Video: https://t.co/4T0ZKvGETn pic.twitter.com/5Yyd1dGNau -
(2b) Staying Put
— Charlie Bilello (@charliebilello) June 27, 2023
62% of US mortgage holders have a rate below 4% and 92% have a rate below 6%. With current mortgage rates at close to 7%, many existing homeowners are staying put, which is the primary reason for the housing shortage...
Video: https://t.co/4T0ZKvGETn pic.twitter.com/bbcgAB9NIE -
(2c) Unaffordable Housing
— Charlie Bilello (@charliebilello) June 27, 2023
The median American household would need to spend over 40% of their income to afford the median priced home for sale today, up from 28% in 2020.
Video: https://t.co/4T0ZKvGETn pic.twitter.com/jaWoaj3slQ -
(3) If You Build It, They Will Come
— Charlie Bilello (@charliebilello) June 27, 2023
US Housing Starts jumped 21% in May, the biggest month-over-month increase since 2016. On a year-over-year basis, starts grew 6%, the first positive YoY reading since April 2022.
Video: https://t.co/DN7wpnlZbd pic.twitter.com/nY0vKIe1J8 -
(4) Rate Hikes & Returns
— Charlie Bilello (@charliebilello) June 28, 2023
Here’s a look at how various asset classes have performed during the last 4 rate-hiking cycles. Conclusion: no two cycles are alike - there's no way to predict in advance how asset classes will react to Fed rate hikes.
Video: https://t.co/Fr6vjI2VTA pic.twitter.com/bkY3J3eUiH -
(5) Why You Need to Invest, in One Chart
— Charlie Bilello (@charliebilello) June 28, 2023
Over the last 30 years, the purchasing power of the US consumer dollar has been cut in half due to inflation. At the same time, the S&P 500 has gained 681 (7% per year) after adjusting for inflation.
Video: https://t.co/l1Db9VMLES pic.twitter.com/FUBliqLMvs -
(6) Q3 Recession?
— Charlie Bilello (@charliebilello) June 28, 2023
The Conference Board’s Leading Economic Index declined in May for the 14th month in a row. They are now calling for a US recession from Q3 2023 to Q1 2014, driven by tight monetary policy and lower government spending.
Video: https://t.co/iPY8fga1hG pic.twitter.com/AGt0vYHTsz -
(7) More Hikes?
— Charlie Bilello (@charliebilello) June 28, 2023
The market continues to price in a July rate hike (82% probability) but after that the Fed is expected to pause for the remainder of the year.
Video: https://t.co/f3bIY74Bhs pic.twitter.com/a7miD5aoJm -
(8) The Downtown Downturn
— Charlie Bilello (@charliebilello) June 28, 2023
Office occupancy in New York and Los Angeles remains at just 50% of pre-covid levels and San Francisco is even lower. Public transit in major cities is still down over 30% from 2019 levels.
Video: https://t.co/RXO2sbM2gE pic.twitter.com/Nk5t3YEvp1 -
(9) Largest Companies in the S&P 500: by Market Cap, Net Income, Revenue, and # of Employees
— Charlie Bilello (@charliebilello) June 29, 2023
Video: https://t.co/EG6AVzxEQN pic.twitter.com/4EUSwVZTrN -
(9) Every Bear Market is Different
— Charlie Bilello (@charliebilello) June 29, 2023
S&P 500 peak in January 2022 vs. peaks in October 2007 and March 2000...
Video: https://t.co/aVNttIjQ58 pic.twitter.com/TNjEdfEU3c -
(12) Supply Chain Healing
— Charlie Bilello (@charliebilello) June 29, 2023
Over a period of 18 months, the NY Fed’s Supply Chain Pressure Index has moved from its worst level ever (December 2021) to its best level ever (May 2023).
Video: https://t.co/7xxfY8TQxx pic.twitter.com/ogZbikC4RJ
