Understanding Z-Scores and Their Shape of Distribution
Learn about the sum of the squared z-scores being equal to the number of z-score values and the shape of the distribution of z-scores being the same as the original shape of the distribution of the underlying data. Understand why this is important in single- or multi-factor investing.

Corey Hoffstein 🏴☠️
CIO @ Newfound Research. 🥞 Return Stacking // 🌊 Liquidity Cascades // 📆 Rebalance Timing Luck. Risk cannot be destroyed, only transformed.

-
TIL that the sum of the squared z-scores is always equal to the number of z-score values.
— Corey Hoffstein 🏴☠️ (@choffstein) June 10, 2023 -
Also, the shape of the distribution of z-scores will be the same as the original shape of the distribution of the underlying data.
— Corey Hoffstein 🏴☠️ (@choffstein) June 10, 2023
This one seems more obvious, since you’re just shifting the scaling. But never thought about it before. -
“why is this important?”
— Corey Hoffstein 🏴☠️ (@choffstein) June 10, 2023
it’s common in single- or multi-factor investing to blend z-scores.
if the underlying data has different shapes, it could lead to one characteristic or factor unintentionally dominating the selection process. -
for example, let’s say you calculate z-scores for momentum and value.
— Corey Hoffstein 🏴☠️ (@choffstein) June 10, 2023
and let’s say momentum data is ~N(0,1) but value data is ~X^2(1).
If you pick the top N stocks based on the average z-score, you may end up massively overweight value. -
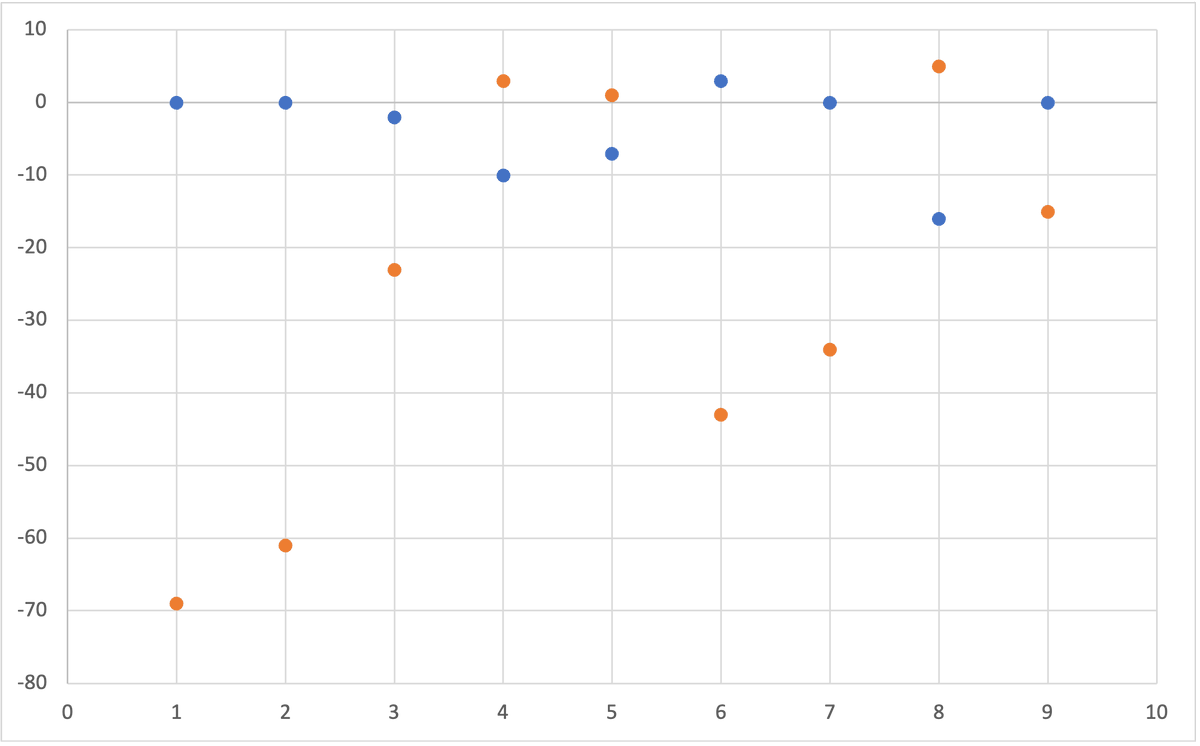
here’s a little experiment to show why this matters.
— Corey Hoffstein 🏴☠️ (@choffstein) June 10, 2023
i generated 100 ~X^2(1) data points and 100 ~N(0,1) data points.
i then calculated the z-scores of each data set.
i averaged the z-scores together and picked the top 10 highest z-scores. -
blue dots show how the ranks of the top 10 differ from the rank order of the ~X^2(1).
— Corey Hoffstein 🏴☠️ (@choffstein) June 10, 2023
orange shows how the ranks differ from the ~N(0,1).
you can see that the rank order of the ~X^2(1) data dominated the selection. pic.twitter.com/OWgdMdZFpJ -
practical example from S&P dow jones: do we expect these different characteristics to share the same shape in the underlying data? pic.twitter.com/keRDFEHrzD
— Corey Hoffstein 🏴☠️ (@choffstein) June 10, 2023 -
market cap is a clear example here.
— Corey Hoffstein 🏴☠️ (@choffstein) June 10, 2023
if i were to do a multi-factor portfolio by selected on the average z-score of momentum, size, and value, size would likely dominate the selection process.
this is why you often see log(size) as the variable.
