Sources of Uncertainty in Global Climate Change Estimates
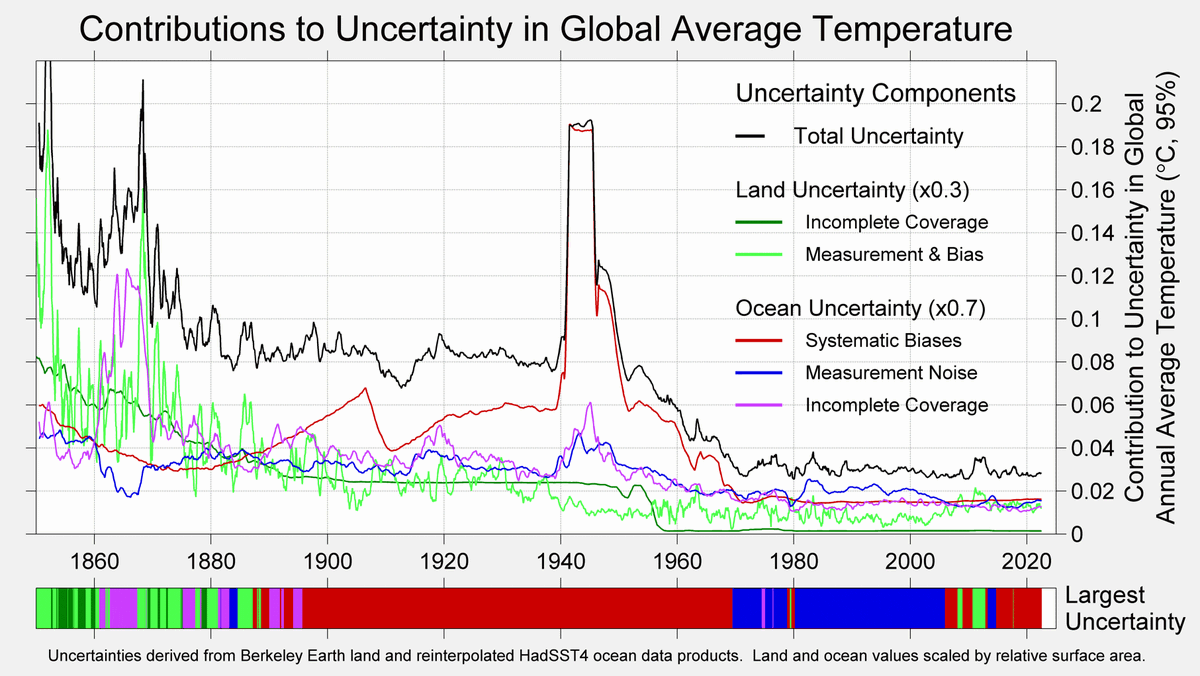
This blog post provides a chart showing the sources of uncertainty in one of the modern estimates of global climate change since 1850. It also explains how the assessed uncertainties are much smaller than the long-term trend.

Dr. Robert Rohde
Lead Scientist @BerkeleyEarth. Physics PhD & data nerd. Usually focused on climate change, fossil fuels, & air quality issues. → @RARohde@fediscience.org

-
Bit of a technical post, but here is a chart showing the sources of uncertainty in one of the modern estimates of global climate change since 1850.
— Dr. Robert Rohde (@RARohde) March 3, 2023
For most of the last 170 years, ocean temperature uncertainties are actually more impactful that land uncertainties. pic.twitter.com/BjAriML5bF -
When we talk about temperature uncertainties, we are talking about the little error bars added to charts like this, based on a scientific assessment of the "known unknowns".
— Dr. Robert Rohde (@RARohde) March 3, 2023
The assessed uncertainties are much smaller than the long-term trend. pic.twitter.com/qnXKUkDecy -
Assessments of uncertainty are complicated, and even labelling them is rarely black & white.
— Dr. Robert Rohde (@RARohde) March 3, 2023
One person's "measurement noise" might be assessed by someone else as related to "systematic biases". -
Similarly, assessments of uncertainty due to incomplete coverage depend on what interpolation methods may have been used, and often create trade-offs.
— Dr. Robert Rohde (@RARohde) March 3, 2023
Interpolations that can reduce coverage biases often increase the impact of measurement & systematic uncertainties. -
Modern weather observing networks are very extensive, but it hasn't always been that way.
— Dr. Robert Rohde (@RARohde) March 3, 2023
Past gaps give rise to coverage uncertainties when we try to estimate how much variation might be missed in regions that weren't observed at the time. pic.twitter.com/EDilr2rP98 -
Typically, coverage uncertainty is assessed by taking modern, spatially-complete weather fields and masking them to resemble past spatially-incomplete observations.
— Dr. Robert Rohde (@RARohde) March 3, 2023
The difference between the original average and the masked average gives an estimate of the coverage uncertainty. -
In addition to coverage gaps, systematic biases are a major concern.
— Dr. Robert Rohde (@RARohde) March 3, 2023
Systematic biases arise when the methods and instruments used to measure temperature change over time in such a way past data and present data are no longer completely comparable. -
For example, originally ocean-going ships measured water temperature by hauling buckets of water onto the deck.
— Dr. Robert Rohde (@RARohde) March 3, 2023
Later, they started measuring engine intake water.
Engine intake water tends come from a bit below the surface, and hence is slightly cooler than the previous method. -
Other examples of systematic biases include changes in the time of measurement or location of a weather station, replacing liquid-in-glass thermometers with thermistors, development of an urban heat island, etc.
— Dr. Robert Rohde (@RARohde) March 3, 2023 -
Many systematic biases are partially correctable.
— Dr. Robert Rohde (@RARohde) March 3, 2023
For example, by comparing the bucket method to the engine intake method, we can estimate the typical difference.
Such corrections reduce error, but questions about the magnitude of such effects gives rise to bias uncertainties. -
Bias uncertainties associated with changing methods of ocean measurement are often the largest uncertainty in the global average.
— Dr. Robert Rohde (@RARohde) March 3, 2023
This is particular pronounced during World War II, when few ships collected data and those that did often used non-standard or unclear techniques. pic.twitter.com/DBsWk7thh5 -
As it turns out, ship captains worried about dodging German U-Boats, didn't really bother to collect weather data. Shocking, I know.
— Dr. Robert Rohde (@RARohde) March 3, 2023
During the war years, reported ocean data volumes dropped 90%. -
The other problem with ocean biases is that they can be harder to detect and correct for.
— Dr. Robert Rohde (@RARohde) March 3, 2023
On land, we can often detect weather station biases by comparing one station to its neighbors over many years.
However, ships don't stay still and many don't have long time series. -
And, of course, the Earth's surface is more than 2/3 water.
— Dr. Robert Rohde (@RARohde) March 3, 2023
So, any uncertainty in the ocean average necessarily has a proportionally larger impact on the global average uncertainty. -
At the end of day, when looking at recent climate change, know that scientists have thought quite deeply about the uncertainties involved.
— Dr. Robert Rohde (@RARohde) March 3, 2023
The assessed uncertainties are much smaller than the warming, and for much of the period, oceans contribute more uncertainty than the land. pic.twitter.com/JuTrKH7hqM
