

Exploring Data Models for Retention Curves
Learn about the data model that forms the foundation of forecasting processes and how to remove outliers and plot points. Discover why a straight retention average won't yield good results.

Taylor Holiday
Follow for insights from a 🏔mountain of eCommerce 📊data Agency CEO https://t.co/P2SGpbrqS5 Brand Partner https://t.co/HPP7oDqTy0 Software Founder https://t.co/deDUAEqJcE DM's open!

-
Here is the data model that forms the foundation of our retention curves in our forecasting process...
— Taylor Holiday (@TaylorHoliday) April 12, 2023
*WARNING* Lots of nerdy 🤓 graphs 📈 ahead: -
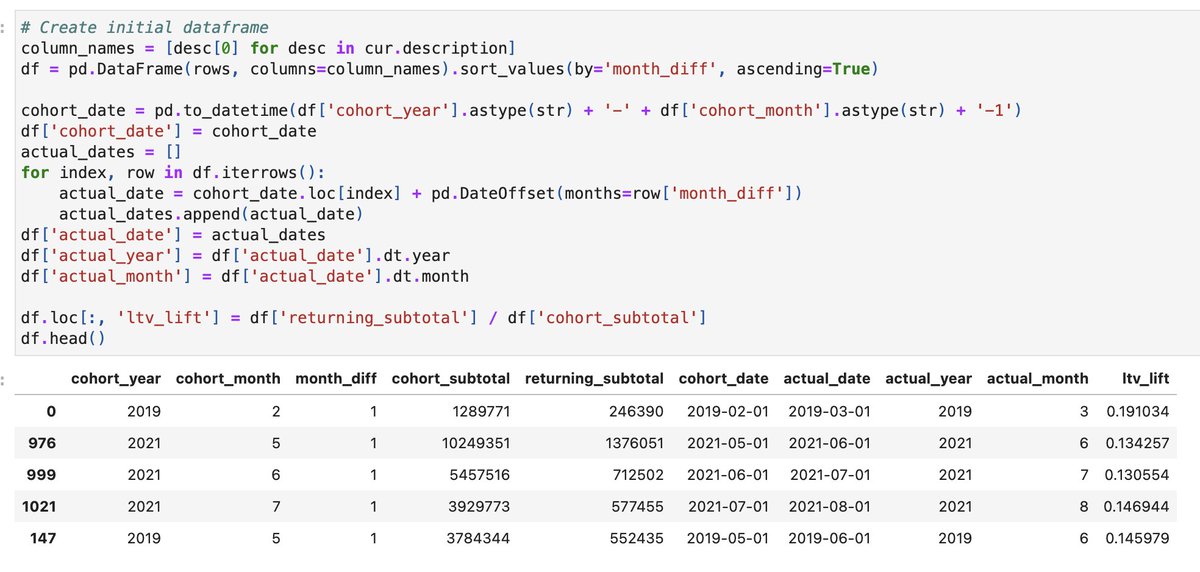
Below is the https://t.co/803Aax1RsI cohorts database where we track each cohort by month of first order.... pic.twitter.com/QiQ2lPdRZw
— Taylor Holiday (@TaylorHoliday) April 12, 2023 -
We then remove outliers and plot all the points.
— Taylor Holiday (@TaylorHoliday) April 12, 2023
This example distribution and trend line shows no pattern forming and there's a wide distribution which doesn't get tighter as the months go on. This is a common signal that a straight retention average won't yield good results. pic.twitter.com/5Yu7gk3OFk -
We then look at the historical curves of the cohorts by year.
— Taylor Holiday (@TaylorHoliday) April 12, 2023
In this example, the curve for each month/year show obvious seasonal patterns which is why the dot plot above was greatly dispersed. pic.twitter.com/2gtEFK22ta -
Now we take a deeper look at the seasonal patters which are critical to building models in eCom since Q4 behaves so differently.
— Taylor Holiday (@TaylorHoliday) April 12, 2023
This graph reinforces what we saw in the previous charts, that there are strong seasonal patterns for this brand. The good news is its very consistent pic.twitter.com/OuwqNDYbna -
Next we look at the trend over time to see if retention is stationary.
— Taylor Holiday (@TaylorHoliday) April 12, 2023
This brand shows a slight increase over time in retention since the launch of the store. This will affect the forecast as it'll assume this trend would continue. pic.twitter.com/rE7ciqhiKU -
Next we run a regression using seasonality, a constant (representing growth), and an autoregressive factor (standard for retention modeling) pic.twitter.com/oMaqZ4uwiE
— Taylor Holiday (@TaylorHoliday) April 12, 2023 -
This example is a very strong model as reflected by the R-squared of .8. The Durbin-Watson of 2.24 shows that the AR-1 is appropriate in capturing movements from one period to the next. Finally, almost all the seasonality is strong with December's P-value not being significant. pic.twitter.com/WpdnejGSeb
— Taylor Holiday (@TaylorHoliday) April 12, 2023 -
Next we check for collinearity.
— Taylor Holiday (@TaylorHoliday) April 12, 2023
No collinearity in this case, so we're safe to keep all the coefficients pic.twitter.com/LewSlZ6Qby -
Now we throw out 2022 and do a backtest and check the shape of the errors. pic.twitter.com/l8a9ttsAG6
— Taylor Holiday (@TaylorHoliday) April 12, 2023 -
R-squared of .83 is again very high so the model shows no degradation despite one less year of data. The residuals graph shows very normally distributed errors. This concludes that the retention model is very strong pic.twitter.com/lUefHfE9Rm
— Taylor Holiday (@TaylorHoliday) April 12, 2023 -
Now we Backtest against the ACTUAL values.
— Taylor Holiday (@TaylorHoliday) April 12, 2023
Below results apply our backtest against the actuals from 2022 and 2023. The errors are tight in the expected range. The errors aren't perfectly normally distributed, meaning it misses on the low side but there weren't many outliers. pic.twitter.com/Hsm6lp7IQq -
Now we get our final model given all of the data.
— Taylor Holiday (@TaylorHoliday) April 12, 2023
This is our final model which is similar to the model we saw above and the conclusion still stands that this model should be able to capture all the available factors when forecasting retention. pic.twitter.com/ZGh7Ko3i4i -
From here we take this retention model and use it as the FOUNDATIONAL input of our total forecasting model.
— Taylor Holiday (@TaylorHoliday) April 12, 2023
the next layer (which I will share soon...) is to add new customer acquisition through spend/cac modeling. -
All of this allows us to instantly generate incredibly accurate expectations for our customer's future revenue all the way down to the P&L level.
— Taylor Holiday (@TaylorHoliday) April 12, 2023
But that is just the start of the job. -
A thoughtful forecast gives you a clear vision of what is LIKELY TO OCCUR and it gives you key inputs to track to help you quickly determine when you are off course.
— Taylor Holiday (@TaylorHoliday) April 12, 2023
But as a growth partner our job is to BREAK THE MODEL.
To disassociate the future from the past. -
If you are interested in seeing this model applied to your business, and would likely to receive a full 2 year growth map. We offer strategy only services that can help internal teams and agencies better set goals and expectations.
— Taylor Holiday (@TaylorHoliday) April 12, 2023
We would love to connect. -
If you enjoyed this thread:
— Taylor Holiday (@TaylorHoliday) April 12, 2023
1. Follow me @TaylorHoliday for more of these
2. RT the tweet below to share this thread with your audience https://t.co/iibGxfJt6l