Comparing Tesla Autopilot and Manual Mode
Tesla Autopilot has a lower accident rate than the national average, but how does it compare to a manually driven Tesla? This blog post looks at the accident rates on surface streets to compare the two.

Tasha Keeney
Director of Investment Analysis & Institutional Strategies @ARKInvest. Also cover things that fly, roll, and manufacture. Disclosure https://t.co/CfmviBEuqw

-
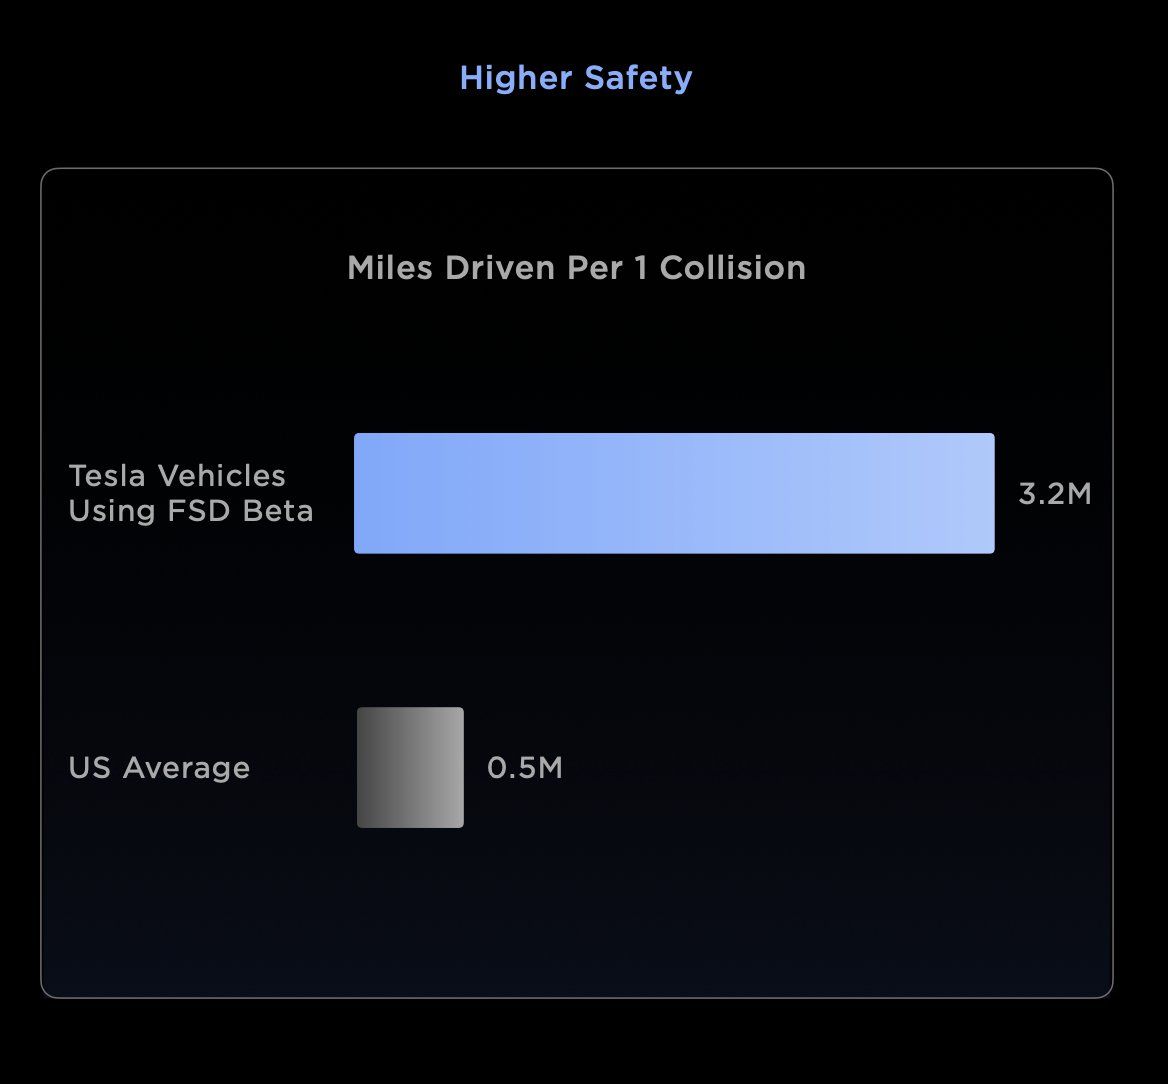
At Tesla's Investor Day, for the first time we saw the accident rate per million miles driven in FSD. Previously the Tesla Safety Report included only Autopilot statistics. 🧵1/10 pic.twitter.com/M8iigRcXXL
— Tasha Keeney (@TashaARK) March 11, 2023 -
1 accident per 3.2M FSD miles. Looks better than the national average, right? However, I'd argue the comparison is not 🍎to🍎 as FSD worked only on surface streets until v11.3. Also, how does this compare to a manually driven Tesla? Let's compare across surface streets only. 2/10
— Tasha Keeney (@TashaARK) March 11, 2023 -
Surface streets have more frequent accident rates than highways. Adjusting the national average and the "Non Autopilot" rate given in Tesla's Safety Report, a Tesla in FSD looks ~5X safer than a Tesla in manual mode 👀‼️3/10 pic.twitter.com/lwMxD9wCrB
— Tasha Keeney (@TashaARK) March 11, 2023 -
Some caveats: A driver might disengage FSD in the most difficult driving moments, which might boost miles per accident. Also, the national average includes cars that don't have features like auto emergency braking, which is now standard on all new cars sold in the US. 4/10
— Tasha Keeney (@TashaARK) March 11, 2023 -
And of course Teslas also have a whole list of active safety features that come standard in every car, which work whether Autopilot is engaged or not. https://t.co/iiCc4ybsK1 5/10
— Tasha Keeney (@TashaARK) March 11, 2023 -
Also note that the national statistics include more than just passenger cars, but passenger cars make up the majority of vehicles in crashes and of total miles. We're also talking about all crashes, including fatal and non fatal. 6/10
— Tasha Keeney (@TashaARK) March 11, 2023 -
Lastly, I'm using 2019 crash data, because latest available is 2020 which could have a COVID skew. But, for these purposes, the data are nearly the same. 7/10
— Tasha Keeney (@TashaARK) March 11, 2023 -
How'd I calculate this? 73% of vehicle miles travelled are on highways, while only 25% of accidents are on highways. The highway-only accident rate is 1.4 million miles per crash, vs. 170k miles per crash for surface streets. 8/10
— Tasha Keeney (@TashaARK) March 11, 2023 -
Manually driven or "Non AP" Tesla miles have a slightly higher ratio of surface street miles, adjusting for ~10% of all fleet miles that occur in Autopilot (9B in AP out of ~90B cumulative miles on cars with AP). Note I used a global stat, which is likely higher in the US. 9/10
— Tasha Keeney (@TashaARK) March 11, 2023 -
I adjust the accident rates to their surface street equivalent using these ratios of %miles and %of accidents for surface streets.
— Tasha Keeney (@TashaARK) March 11, 2023
TL;DR: Tesla's first report on its FSD safety rate suggests that using FSD is 5X safer than not using it (🤖>🧠). 10/10 -
Inspired by some work from @bradtem 👋
— Tasha Keeney (@TashaARK) March 11, 2023
